Unemployment vs. Housing prices
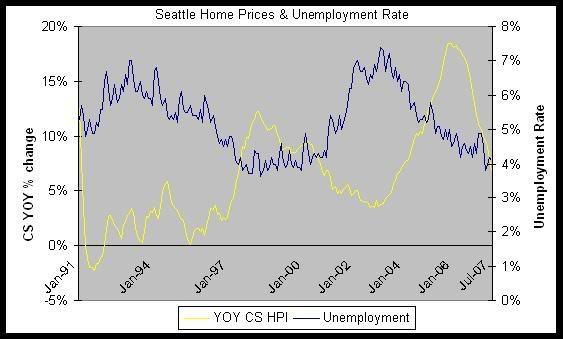
Tim made a post today about the link between unemployment and housing. I thought the topic was interesting, but needed some additional context. Deejayoh could probably produce prettier charts, but this is the best I can crank out in a few minutes. See below for a chart of unemployment vs. housing price changes 1991-present for Seattle. The chart does appear to show some connection between falling unemployment and rising prices (1998-2000 and 2004-mid 2006).
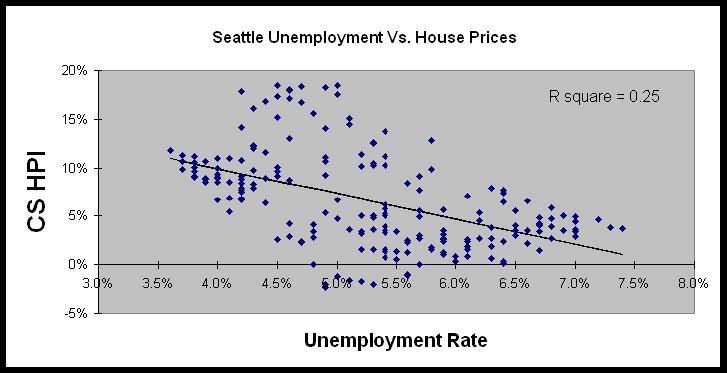
I also ran a simple regression plot (below), which shows a pretty strong inverse relationship between unemployment and housing prices. The R squared is 0.25 and clearly doesn't explain all the variation in home prices, but unemployment's impact is clearly statistically significant (P<.001).
Data used:
- Housing prices come from Case Shiller HPI and are represented as YOY % changes
- Unemployment is from the BLS website: http://data.bls.gov/cgi-bin/surveymost?la+53